I tried to go into interactive mode (so that I can zoom in a plot) by executing %matplotlib notebook in IPython kernel. Instead of interactive plot, it resulted in no plot at all. So I had to execute %matplotlib inline to get the plot again.
So I was wondering if it’s possible to introduce interactive plotting in Datalore using IPython kernel. It appears I can use datalore.plot in Datalore kernel to obtain interactive plots. I, however, cannot go for this option as I have to share my codes with people not using Datalore kernel.
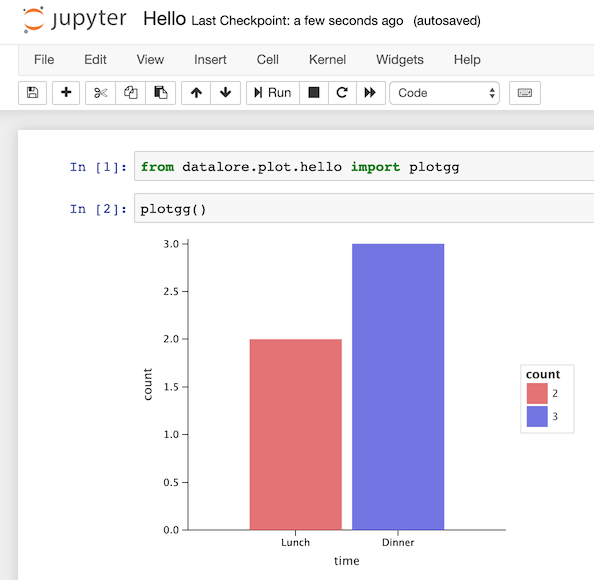
Right, as @Dmitry_Trofimov said we are working on making datalore plot publicly available as a python package and compatible with frontends other than Datalore (Jupyter notebook in the first place).
It is not yet available but it’s coming really soon.
Cool, good to know that! I understand this datalore.plot package for Jupyter/IPython will very much give me the interactive plot as I required. But what I originally referred to was the interactive mode for matplotlib.pyplot.plot with your IPython kernel.